10 Module 9: Database Design Practicum
10.1 Module Overview
10.1.1 Learning Objectives
By the end of this module, students will be able to:
- Be able to take a description of a dataset and convert it into an E/R model of it.
- Be able to translate the E/R diagram to a relational database schema.
- Be able to write an SQL script to implement the schema in SQLite.
- Be able to populate an existing databse with data contained in CSV files using SQL statements.
- Be able to create, read, update and delete (CRUD) data in the SQLite database using SQL.
- Understand that SQL statements (and the database schema under it) can be abstracted into higher-level structures such as a RESTful API, or a web application.
- Understand that higher levels of abstraction are possible, particularly through the use of LLMs and their ability to parse natural language.
10.1.2 Topics Covered
- ER Diagrams in Practice
- The Relational Model
- Implementing a Relational Database
- Data Ingestion
- CRUD Using SQL
- CRUD using a Web Framework
- CRUD using Natural Language
10.1.3 Project Milestones
Define the structure of your final report, and set milestones for completing each section.
10.2 Lecture Notes
10.2.1 The Problem: Connecting Thermal Comfort and Energy Use
Throughout this module, we will work through a complete database design and implementation problem: understanding the relationship between thermal comfort and energy consumption in a residential building.
10.2.1.1 Problem Statement
Imagine you want to answer the question: What is the energy use required to keep occupants comfortable, and how does it change by season of the year?
To answer this, you have access to multiple data sources:
- Ecobee Thermostat: Provides temperature readings, humidity, HVAC mode (heating, cooling, fan-only), and runtime data for different zones in the house
- eGauge Power Meter: Monitors electrical consumption across all circuits in the electrical panel, including HVAC equipment
- Smart Watches: Each occupant wears a device that:
- Tracks skin temperature continuously
- Periodically prompts for thermal comfort ratings using the PMV (Predicted Mean Vote) scale (-3 to +3, where -3 is cold, 0 is neutral, and +3 is hot)
- Detects which room the occupant is currently in
- Weather Data: Outside temperature, humidity, and other environmental conditions from a nearby weather station
10.2.1.2 The Question We Want to Answer
We want to determine the energy consumption required to maintain thermal comfort. For this analysis, we’ll define “comfortable” as having a mean PMV rating across all occupants between -0.5 and +0.5.
Specifically, we want to understand: - How much energy is consumed during periods when occupants are comfortable vs. uncomfortable? - How does this relationship vary by season? - What thermostat settings and HVAC modes are associated with comfort at different times of year?
10.2.1.3 What We’ll Build
To answer these questions, we will:
- Design an Entity-Relationship (E/R) diagram capturing all relevant entities and their relationships
- Transform this E/R diagram into a relational database schema
- Implement the schema in SQLite using SQL DDL statements
- Create sample data representing one year of measurements
- Populate the database by ingesting data from CSV files
- Write SQL queries to perform CRUD operations and answer our analytical questions
- Build a simple Flask web application that provides a RESTful API for database access
- Demonstrate how natural language interfaces (via LLMs) can simplify database interactions
This hands-on example will tie together all the concepts from previous modules and demonstrate how database design supports real-world data analysis in civil and environmental engineering.
10.2.2 ER Diagrams in Practice
Creating an Entity-Relationship (E/R) diagram is the first step in database design. The goal is to identify the entities (things we want to store information about), their attributes (properties of those things), and the relationships between them.
10.2.2.1 Step 1: Identify Entities from the Problem Description
Looking back at our problem statement, we’re collecting data from multiple sources. Each distinct “thing” we’re measuring or tracking is a candidate entity:
- Occupants - The people living in the house who report comfort levels
- Rooms - The physical spaces where comfort is measured
- Comfort Ratings - Individual comfort assessments from occupants
- HVAC Readings - Thermostat and heating/cooling system measurements
- Power Readings - Electrical consumption measurements
- Weather Readings - Outside environmental conditions
Each of these will become a table in our database.
10.2.2.2 Step 2: Identify Attributes
For each entity, we need to determine what information to store. Let’s work through each one:
Occupant:
occupant_id(primary key): Unique identifier for each personoccupant_name: The person’s name
Room:
room_id(primary key): Unique identifier for each roomroom_name: The room’s name (e.g., “Living Room”, “Kitchen”)
ComfortRating:
comfort_id(primary key): Unique identifier for each ratingpmv_rating: The PMV (Predicted Mean Vote) score from -3 to +3skin_temp: Skin temperature in Celsiuscomfort_timestamp: When the rating was recorded- Foreign keys (relationships):
occupant_id,room_id
HVACReading:
hvac_id(primary key): Unique identifier for each readingheating_runtime: Minutes of heating in the measurement periodcooling_runtime: Minutes of cooling in the measurement periodfan_state: Whether the fan is on or offtemp_setpoint: Target temperature settingthermostat_temp: Actual measured temperaturehvac_timestamp: When the reading was recorded
PowerReading:
power_id(primary key): Unique identifier for each readingpower_consumption: Power consumption in kilowattspower_timestamp: When the reading was recorded
WeatherReading:
weather_id(primary key): Unique identifier for each readingoutside_temp: Outside temperature in Fahrenheitoutside_humidity: Outside relative humidity percentageweather_timestamp: When the reading was recorded
10.2.2.3 Step 3: Identify Relationships
Now we determine how entities connect to each other:
- Occupant → ComfortRating: One-to-Many
- Each occupant can submit many comfort ratings over time
- Each comfort rating belongs to exactly one occupant
- Room → ComfortRating: One-to-Many
- Each room can have many comfort ratings (from different occupants at different times)
- Each comfort rating is associated with exactly one room
10.2.2.4 Step 4: Design Decisions
There is no single correct way of desigining this E/R diagram. Every design is just a set of choices we make and each of them has pros and cons. For example, notice some choices we did not make:
No explicit time hierarchy entities (Hour, Day, Season, Year): Instead, we use timestamps and can extract temporal information using SQL date functions when needed. This is simpler and more flexible.
No direct relationships between readings: HVAC, Power, and Weather readings are independent time series. We’ll join them based on timestamps when analyzing the data.
But it can be argued that this was a pragmatic design choice: we’re optimizing for simplicity and query flexibility rather than enforcing rigid temporal structures in the schema.
10.2.2.5 The Complete ER Diagram
Here’s our simplified ER diagram:
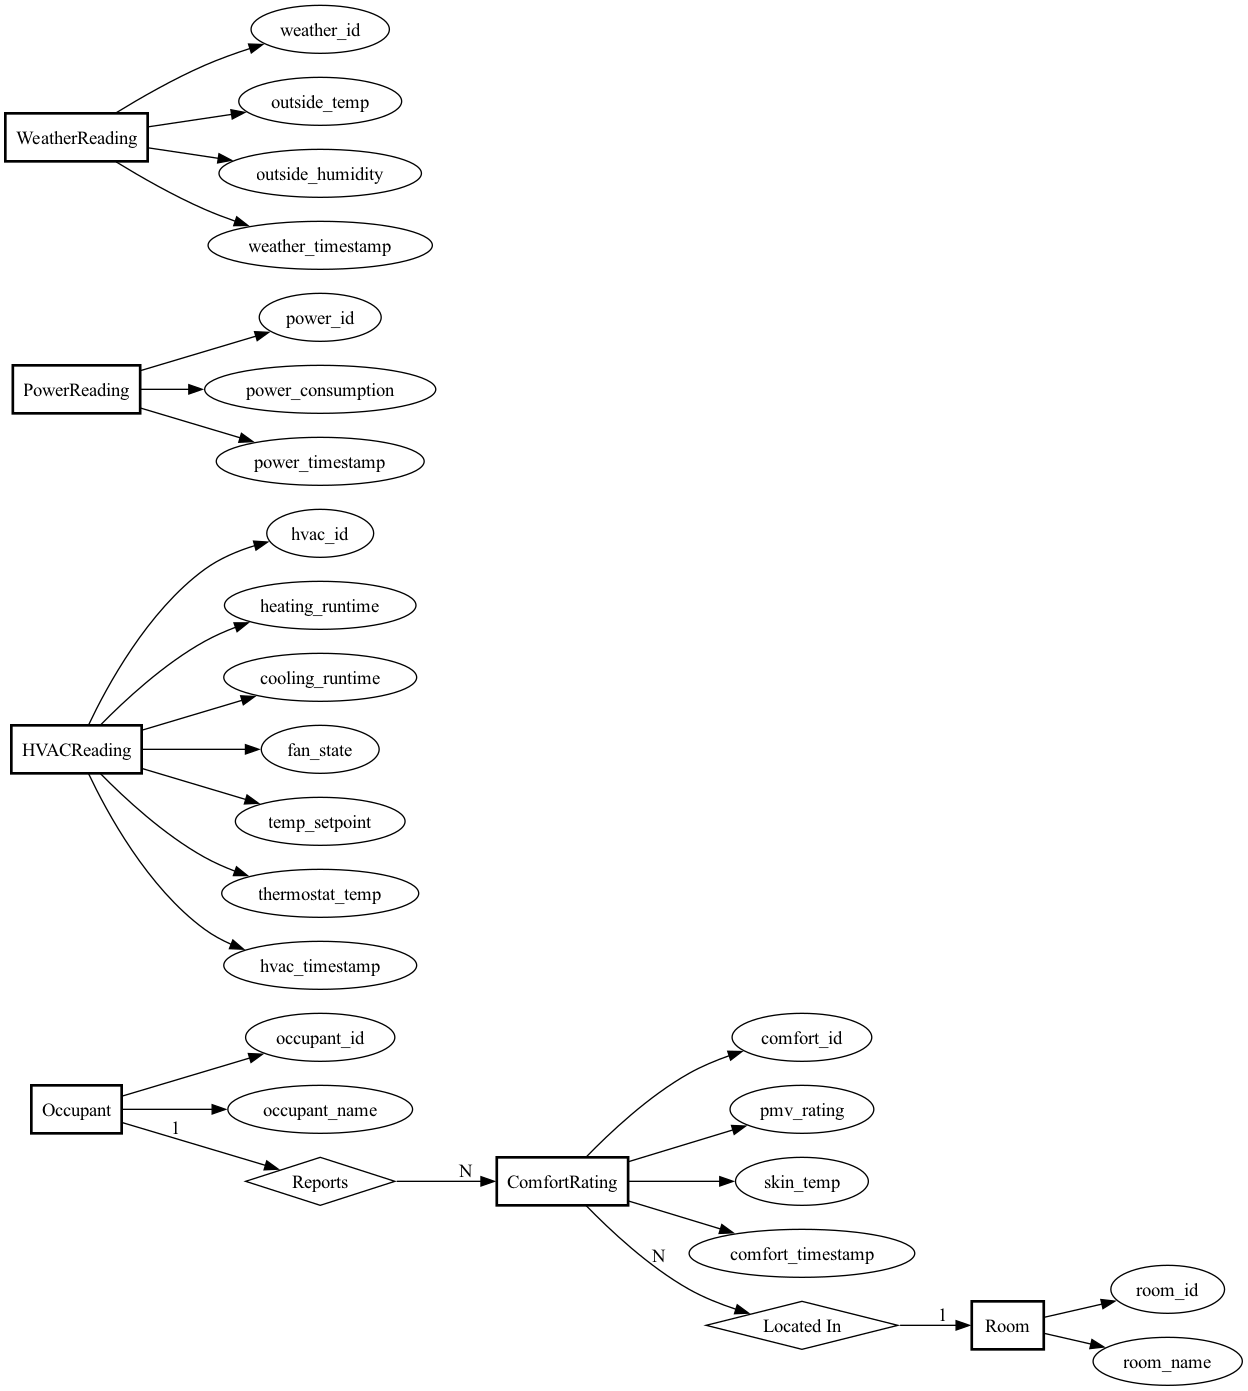
Key features of this design:
- Clean separation of concerns: Each entity represents one type of measurement or dimension
- Timestamp-based: All time-series data uses timestamps rather than complex time hierarchies
- Foreign keys enforce integrity: Comfort ratings must reference valid occupants and rooms
- Ready for time-based joins: The timestamp fields let us correlate readings across tables using SQL date/time functions
This design gives us the flexibility to answer questions like:
- “What was the average comfort level when the HVAC was in heating mode?”
- “How does power consumption correlate with outside temperature by season?”
- “Which rooms have the most comfort complaints?”
All without needing to pre-define how we’ll slice time (by hour, day, week, season, etc.).
10.2.3 The Relational Model
Now that we have our ER diagram, let’s translate it into a relational schema. You’ve seen the theory in previous modules—here’s how we apply it to our thermal comfort problem.
10.2.3.1 Translating the ER Diagram
Following the standard translation rules, each entity becomes a table and relationships become foreign keys. Here’s our complete schema:
Dimension Tables:
-- Occupant table
CREATE TABLE Occupant (
    occupant_id INTEGER PRIMARY KEY,
    occupant_name TEXT NOT NULL
);

-- Room table
CREATE TABLE Room (
    room_id INTEGER PRIMARY KEY,
    room_name TEXT NOT NULL
);
Fact Tables:
-- ComfortRating table
CREATE TABLE ComfortRating (
    comfort_id INTEGER PRIMARY KEY,
    occupant_id INTEGER NOT NULL,
    room_id INTEGER NOT NULL,
    pmv_rating REAL NOT NULL,
    skin_temp REAL NOT NULL,
    comfort_timestamp DATETIME NOT NULL,
    FOREIGN KEY (occupant_id) REFERENCES Occupant(occupant_id),
    FOREIGN KEY (room_id) REFERENCES Room(room_id)
);

-- HVACReading table
CREATE TABLE HVACReading (
    hvac_id INTEGER PRIMARY KEY,
    heating_runtime REAL NOT NULL,
    cooling_runtime REAL NOT NULL,
    fan_state TEXT NOT NULL,
    temp_setpoint REAL NOT NULL,
    thermostat_temp REAL NOT NULL,
    hvac_timestamp DATETIME NOT NULL
);

-- PowerReading table
CREATE TABLE PowerReading (
    power_id INTEGER PRIMARY KEY,
    power_consumption REAL NOT NULL,
    power_timestamp DATETIME NOT NULL
);

-- WeatherReading table
CREATE TABLE WeatherReading (
    weather_id INTEGER PRIMARY KEY,
    outside_temp REAL NOT NULL,
    outside_humidity REAL NOT NULL,
    weather_timestamp DATETIME NOT NULL
);
10.2.3.2 What Happened to the Relationships?
You learned that relationships can be translated into tables with foreign keys to the participating entities. Our ER diagram shows two relationships:
- Reports: Occupant → ComfortRating (1:N)
- LocatedIn: Room → ComfortRating (1:N)
We could have created separate Reports and LocatedIn tables, each with foreign keys. But for one-to-many relationships, there’s a more efficient approach: just add the foreign key directly to the “many” side.
Instead of:
-- Less efficient approach
CREATE TABLE Reports (
    occupant_id INTEGER,
    comfort_id INTEGER,
    FOREIGN KEY (occupant_id) REFERENCES Occupant(occupant_id),
    FOREIGN KEY (comfort_id) REFERENCES ComfortRating(comfort_id)
);
We do:
-- More efficient approach
CREATE TABLE ComfortRating (
    comfort_id INTEGER PRIMARY KEY,
    occupant_id INTEGER NOT NULL,  -- Foreign key embedded here
    ...
);
This avoids an extra table and extra joins. Each ComfortRating row directly stores which occupant reported it and which room it’s for.
When would you create a separate relationship table? For many-to-many relationships. For example, if we tracked “which occupants are authorized to adjust settings in which rooms” (many occupants, many rooms, many-to-many), we’d need a separate RoomAccess table with (occupant_id, room_id) pairs.
10.2.3.3 Design Choices Worth Noting
Why separate dimension and fact tables? This follows the star schema pattern. Dimensions (Occupant, Room) are relatively static, while facts (readings, ratings) are high-volume time series. This separation makes queries efficient and updates logical.
Why no time hierarchy tables? We considered adding Hour, Day, Season, and Year tables. But for this application, using timestamps and SQL date functions is simpler and more flexible. We can extract temporal groupings in queries without pre-defining the hierarchy in the schema.
Normalization? The schema is in 3NF: no redundancy, no transitive dependencies. For example, occupant_name lives only in the Occupant table, not duplicated in every ComfortRating row.
Foreign keys in fact tables only? Notice that ComfortRating has foreign keys to Occupant and Room because there’s a semantic relationship: comfort ratings are reported by occupants in specific rooms. But HVACReading, PowerReading, and WeatherReading have no foreign keys—they’re independent time series we’ll correlate via timestamps in queries.
10.2.3.4 What This Schema Lets Us Do
This design supports the analytical queries we need:
- Join comfort ratings with HVAC/power/weather data based on matching timestamps
- Filter by occupant or room using the foreign key relationships
- Extract temporal patterns (by hour, day, season) using SQL date functions on timestamps
- Aggregate measurements across different dimensions
In the next sections, we’ll implement this schema in SQLite and populate it with a year’s worth of synthetic data.
10.2.4 Implementing a Relational Database
With our schema designed, it’s time to create the actual database. This section covers executing the DDL statements in SQLite and understanding SQLite-specific implementation details.
10.2.4.1 Creating the Database
We’ve saved our schema in a file called schema.sql. To create the database:
sqlite3 comfort-energy.db < schema.sqlThis creates a file called comfort-energy.db with all six tables. The file starts at 32KB (SQLite’s minimum file size) and will grow as we add data.
10.2.4.2 SQLite-Specific Implementation Details
INTEGER PRIMARY KEY Auto-increment:
In SQLite, INTEGER PRIMARY KEY is special—it’s an alias for the built-in ROWID. This means:
- SQLite automatically assigns sequential IDs if you don’t provide them
- No need for
AUTOINCREMENTkeyword (and you shouldn’t use it—it’s slower and rarely necessary) - IDs are guaranteed unique and stable
Data Type Storage:
SQLite uses dynamic typing, but our column type declarations provide storage hints:
INTEGER: Stored as 1, 2, 3, 4, 6, or 8 bytes depending on value magnitudeREAL: 8-byte IEEE floating point (equivalent toDOUBLEin other databases)TEXT: Variable-length UTF-8 or UTF-16 encoded stringDATETIME: Not a real type—SQLite stores it asTEXTin ISO 8601 format (YYYY-MM-DD HH:MM:SS)
Foreign Key Enforcement:
This is critical: SQLite supports foreign key constraints, but they’re disabled by default for backward compatibility. You must enable them for each database connection:
PRAGMA foreign_keys = ON;Without this, SQLite will silently accept invalid foreign key values (e.g., a ComfortRating referencing a non-existent occupant_id). Always enable this pragma when working with databases that use referential integrity.
10.2.4.3 Verifying the Database Structure
Let’s verify the database was created correctly. First, list all tables:
sqlite3 comfort-energy.db ".tables"Output:
ComfortRating HVACReading Occupant PowerReading Room WeatherReadingAll six tables exist. Now check the full schema:
sqlite3 comfort-energy.db ".schema"This outputs the complete DDL, confirming our table definitions match the design. The database structure is now ready for data.
10.2.5 Data Ingestion
With an empty database structure in place, we need to populate it with data. In practice, this data would come from real sensors (ecobee, eGauge, smart watches, weather APIs). For this module, we’ve generated one year of realistic synthetic data.
10.2.5.1 Generating Synthetic Data
We created a Python script (generate_data.py) that produces CSV files with realistic patterns:
- 4 occupants: Alice Johnson, Bob Martinez, Carol Chen, David Kim
- 6 rooms: Living Room, Kitchen, Master Bedroom, Bedroom 2, Office, Basement
- Weather readings: 8,784 rows (hourly for 366 days in 2024)
- HVAC readings: 105,408 rows (every 5 minutes)
- Power readings: 105,408 rows (every 5 minutes, correlated with HVAC)
- Comfort ratings: 5,096 rows (2-5 random surveys per occupant per day)
The synthetic data includes realistic patterns:
- Seasonal temperature variations (Pittsburgh climate)
- HVAC mode switching based on outside temperature and setpoint
- Power consumption correlated with HVAC runtime (heating ~3.5kW, cooling ~4.0kW when active)
- PMV ratings mostly near 0 (comfortable) with occasional outliers (20% uncomfortable)
- Skin temperature correlated with comfort ratings
Here’s a sample of the comfort ratings CSV:
comfort_id,occupant_id,room_id,pmv_rating,skin_temp,comfort_timestamp
1,1,3,0.14,33.33,2024-01-01 17:53:00
2,1,5,-0.03,33.1,2024-01-01 17:51:00
3,2,3,-2.42,31.97,2024-01-01 21:08:00
10.2.5.2 Loading Data with SQLite’s .import Command
SQLite provides a .import command for bulk loading CSV files. Our database-loader.sql script automates this:
-- Enable foreign key constraints
PRAGMA foreign_keys = ON;

-- Set CSV mode
.mode csv

-- Import each table
.import occupants.csv Occupant
.import rooms.csv Room
.import weather_readings.csv WeatherReading
.import hvac_readings.csv HVACReading
.import power_readings.csv PowerReading
.import comfort_ratings.csv ComfortRating

-- Remove header rows that got imported as data
DELETE FROM WeatherReading WHERE weather_id = 'weather_id';
DELETE FROM HVACReading WHERE hvac_id = 'hvac_id';
DELETE FROM PowerReading WHERE power_id = 'power_id';
DELETE FROM ComfortRating WHERE comfort_id = 'comfort_id';
Important details:
Foreign key order matters: We import
OccupantandRoomfirst becauseComfortRatinghas foreign keys referencing them. WithPRAGMA foreign_keys = ON, SQLite would reject comfort ratings referencing non-existent occupants.Header row handling: SQLite’s
.importcommand treats the first row as data, not a header. We delete rows where the ID equals the column name string to remove these.CSV mode:
.mode csvtells SQLite to expect comma-separated values with proper quote handling.
Run the import:
sqlite3 comfort-energy.db < database-loader.sql10.2.5.3 Verifying the Data Load
After importing, verify the row counts:
SELECT 'Occupants:' as table_name, COUNT(*) as count FROM Occupant
UNION ALL SELECT 'Rooms:', COUNT(*) FROM Room
UNION ALL SELECT 'ComfortRatings:', COUNT(*) FROM ComfortRating
UNION ALL SELECT 'HVACReadings:', COUNT(*) FROM HVACReading
UNION ALL SELECT 'PowerReadings:', COUNT(*) FROM PowerReading
UNION ALL SELECT 'WeatherReadings:', COUNT(*) FROM WeatherReading;
Output:
Occupants:|4
Rooms:|6
ComfortRatings:|5096
HVACReadings:|105408
PowerReadings:|105408
WeatherReadings:|8784
Let’s spot-check the data looks correct:
SELECT * FROM Occupant;Output:
1|Alice Johnson
2|Bob Martinez
3|Carol Chen
4|David Kim
And a sample comfort rating:
SELECT * FROM ComfortRating LIMIT 3;Output:
1|1|3|0.14|33.33|2024-01-01 17:53:00
2|1|5|-0.03|33.1|2024-01-01 17:51:00
3|2|3|-2.42|31.97|2024-01-01 21:08:00
The data is loaded correctly. We now have a year’s worth of thermal comfort and energy data ready for analysis.
10.2.6 CRUD Using SQL
With our database populated, we can now perform Create, Read, Update, and Delete (CRUD) operations using SQL. This section demonstrates both basic CRUD operations and analytical queries that answer our research question about thermal comfort and energy use.
10.2.6.1 CREATE: Inserting New Data
Add a new room to the database:
INSERT INTO Room (room_name) VALUES ('Guest Room');SQLite automatically assigns room_id = 7 (the next available ID). Verify:
SELECT * FROM Room;Output:
1|Living Room
2|Kitchen
3|Master Bedroom
4|Bedroom 2
5|Office
6|Basement
7|Guest Room
Add a new comfort rating:
INSERT INTO ComfortRating (occupant_id, room_id, pmv_rating, skin_temp, comfort_timestamp)
VALUES (1, 3, -0.5, 32.8, '2024-12-01 14:30:00');
This records that Alice Johnson (occupant 1) felt slightly cool (PMV = -0.5) in the Master Bedroom at 2:30 PM on December 1st.
10.2.6.2 READ: Querying Data
Simple query: Find all comfort ratings for a specific occupant:
SELECT * FROM ComfortRating
WHERE occupant_id = 1
LIMIT 5;
Analytical query 1: Energy use by season
This answers part of our main question: how does energy consumption vary by season?
SELECT
    CASE
        WHEN CAST(strftime('%m', power_timestamp) AS INTEGER) IN (12, 1, 2) THEN 'Winter'
        WHEN CAST(strftime('%m', power_timestamp) AS INTEGER) IN (3, 4, 5) THEN 'Spring'
        WHEN CAST(strftime('%m', power_timestamp) AS INTEGER) IN (6, 7, 8) THEN 'Summer'
        ELSE 'Fall'
    END as season,
    ROUND(AVG(power_consumption), 2) as avg_power_kw,
    ROUND(SUM(power_consumption * 5.0 / 60.0), 2) as total_kwh
FROM PowerReading
GROUP BY season
ORDER BY
    CASE season
        WHEN 'Winter' THEN 1
        WHEN 'Spring' THEN 2
        WHEN 'Summer' THEN 3
        ELSE 4
    END;
Output:
Winter|4.30|9384.88
Spring|3.41|7532.38
Summer|2.30|5089.12
Fall|3.40|7428.09
Key insight: Winter energy use is 84% higher than summer, primarily due to heating loads in Pittsburgh’s cold climate.
Analytical query 2: Comfort levels by room
Which rooms have the most comfort complaints?
SELECT
    r.room_name,
    COUNT(*) as total_ratings,
    ROUND(AVG(cr.pmv_rating), 2) as avg_pmv,
    SUM(CASE WHEN cr.pmv_rating < -0.5 OR cr.pmv_rating > 0.5 THEN 1 ELSE 0 END) as uncomfortable_count,
    ROUND(100.0 * SUM(CASE WHEN cr.pmv_rating < -0.5 OR cr.pmv_rating > 0.5 THEN 1 ELSE 0 END) / COUNT(*), 1) as pct_uncomfortable
FROM ComfortRating cr
JOIN Room r ON cr.room_id = r.room_id
GROUP BY r.room_name
ORDER BY pct_uncomfortable DESC;
Output:
Living Room|841|0.03|253|30.1
Basement|845|-0.01|247|29.2
Bedroom 2|842|0.01|230|27.3
Office|874|0.01|235|26.9
Kitchen|839|0.0|221|26.3
Master Bedroom|855|0.02|210|24.6
Key insight: The Living Room has the highest discomfort rate (30.1%), while the Master Bedroom is most comfortable (24.6% uncomfortable). This might indicate HVAC zoning issues or different usage patterns.
Analytical query 3: Overall comfort statistics
SELECT
    ROUND(AVG(pmv_rating), 3) as overall_avg_pmv,
    ROUND(100.0 * SUM(CASE WHEN pmv_rating BETWEEN -0.5 AND 0.5 THEN 1 ELSE 0 END) / COUNT(*), 1) as pct_comfortable
FROM ComfortRating;
Output:
0.012|72.6Key insight: On average, PMV is nearly neutral (0.012), and occupants are comfortable 72.6% of the time. This aligns with our data generation assumptions (80% comfortable with some variation).
Analytical query 4: Daily energy consumption
SELECT
    DATE(power_timestamp) as date,
    ROUND(SUM(power_consumption * 5.0 / 60.0), 2) as daily_kwh
FROM PowerReading
GROUP BY DATE(power_timestamp)
ORDER BY date
LIMIT 10;
Output:
2024-01-01|103.51
2024-01-02|103.1
2024-01-03|103.52
2024-01-04|104.16
2024-01-05|101.55
2024-01-06|103.55
2024-01-07|102.29
2024-01-08|100.89
2024-01-09|103.59
2024-01-10|102.95
Daily winter consumption averages ~103 kWh. Summer days (not shown) average ~70 kWh.
10.2.6.3 UPDATE: Modifying Existing Data
Rename a room (maybe “Office” becomes “Home Office”):
UPDATE Room
SET room_name = 'Home Office'
WHERE room_id = 5;
Verify the change:
SELECT * FROM Room WHERE room_id = 5;Output:
5|Home OfficeCorrect an erroneous comfort rating:
UPDATE ComfortRating
SET pmv_rating = 0.0
WHERE comfort_id = 100 AND pmv_rating > 2.0;
This might be used if a sensor malfunction reported unrealistic values.
10.2.6.4 DELETE: Removing Data
Delete the guest room we added earlier:
DELETE FROM Room WHERE room_id = 7;Verify it’s gone:
SELECT COUNT(*) as room_count FROM Room;Output:
6Delete comfort ratings from a specific day (perhaps sensor was broken):
DELETE FROM ComfortRating
WHERE DATE(comfort_timestamp) = '2024-01-15';Important: Be careful with DELETE. Foreign key constraints protect you from deleting referenced data. For example, trying to delete an occupant who has comfort ratings would fail (if we had ON DELETE RESTRICT set), or would cascade delete all their ratings (if we had ON DELETE CASCADE). Our current schema doesn’t specify, so SQLite allows the delete but leaves orphaned comfort ratings—which violates referential integrity.
10.2.6.5 Answering the Main Question
Combining these queries, we can now answer: What is the energy use required to keep occupants comfortable, and how does it change by season?
From our analysis:
- Winter comfort requires ~103 kWh/day (~9,385 kWh over winter months)
- Summer comfort requires ~70 kWh/day (~5,089 kWh over summer months)
- Overall, occupants are comfortable 72.6% of the time with mean PMV near neutral
- Spatial variation: Comfort varies by room, with Living Room being least comfortable
The higher winter energy use reflects Pittsburgh’s heating-dominated climate. More sophisticated queries could correlate specific comfort periods with power consumption to isolate the “cost of comfort” more precisely.
10.2.7 CRUD using a Web Framework
In the previous section, we interacted with our database directly through SQL commands. While this is powerful, it’s not practical for end users who need a more intuitive interface. Web frameworks let us abstract SQL operations behind user-friendly forms and pages.
We’ll use Flask, a lightweight Python web framework, to build a simple web interface for our thermal comfort database. The goal is to show how the exact SQL queries we wrote earlier can be triggered through a web browser.
10.2.7.1 Conceptual Overview: From SQL to Web Interface
The transformation is straightforward:
| SQL Operation | Web Interface |
|---|---|
SELECT * FROM Room |
Web page displaying table of rooms |
INSERT INTO Room VALUES (...) |
HTML form with “Add Room” button |
UPDATE Room SET ... |
Edit form with room name input |
DELETE FROM Room WHERE ... |
Delete button with confirmation page |
The web framework acts as a thin layer between the browser and the database:
- User clicks a link or submits a form in their browser
- Flask receives the HTTP request
- Flask executes the corresponding SQL query
- Flask formats the results as HTML and sends it back to the browser
10.2.7.2 Architecture
Our Flask application consists of:
app.py - Main application file (~200 lines)
- Database connection logic
- Route handlers (functions that respond to URLs)
- Each route executes SQL and renders a template
templates/ - HTML templates (11 files)
base.html- Common layout and navigation- CRUD pages:
rooms.html,add_room.html,edit_room.html, etc. - Analytics pages:
energy_by_season.html,comfort_by_room.html, etc.
Each page displays the SQL query it executes, creating a direct learning connection to the previous section.
10.2.7.3 Key Flask Patterns
Pattern 1: Displaying Query Results
@app.route('/rooms')
def list_rooms():
    """READ: List all rooms"""
    conn = get_db_connection()
    rooms = conn.execute('SELECT * FROM Room ORDER BY room_id').fetchall()
    conn.close()
    return render_template('rooms.html', rooms=rooms)
This maps the URL /rooms to a function that: 1. Connects to the database 2. Executes the same SELECT query we used before 3. Passes results to an HTML template 4. Returns the rendered page to the browser
Pattern 2: Processing Form Submissions
@app.route('/rooms/add', methods=['GET', 'POST'])
def add_room():
    """CREATE: Add a new room"""
    if request.method == 'POST':
        room_name = request.form['room_name']
        conn = get_db_connection()
        conn.execute('INSERT INTO Room (room_name) VALUES (?)', (room_name,))
        conn.commit()
        conn.close()
        return redirect(url_for('list_rooms'))
    return render_template('add_room.html')
This handles both: - GET request: Show the form (when user visits /rooms/add) - POST request: Process the form data and execute INSERT (when user submits)
The ? placeholder prevents SQL injection attacks - Flask safely escapes the user input.
Pattern 3: Analytical Queries
The same analytical queries from the previous section become web pages:
@app.route('/analytics/energy-by-season')
def energy_by_season():
    """Analytical query: Energy consumption by season"""
    conn = get_db_connection()
    results = conn.execute('''
        SELECT
            CASE
                WHEN CAST(strftime('%m', power_timestamp) AS INTEGER) IN (12, 1, 2) THEN 'Winter'
                ...
            END as season,
            ROUND(AVG(power_consumption), 2) as avg_power_kw,
            ROUND(SUM(power_consumption * 5.0 / 60.0), 2) as total_kwh
        FROM PowerReading
        GROUP BY season
        ...
    ''').fetchall()
    conn.close()
    return render_template('energy_by_season.html', results=results)
This is the exact same SQL from the previous section, just wrapped in a Flask route.
10.2.7.4 What’s Implemented
The complete application includes:
CRUD Operations: - Rooms: Full CRUD (create, read, update, delete) - Comfort Ratings: Create and read with foreign key dropdowns
Analytical Queries: - Energy consumption by season - Comfort levels by room - Overall comfort statistics - Daily energy consumption
Features: - Delete operations require confirmation (as you requested) - Each page shows the SQL query being executed - Foreign key constraints are enforced - Simple, clean interface with minimal styling
10.2.7.5 Running the Application
The complete source code is available here.
To run it locally:
Unzip the file you downloaded:
unzip comfort-app.zipInstall Flask (if not already installed):
pip install flaskRun the application:
python3 app.pyOpen your browser to
http://127.0.0.1:5000/
You’ll see a homepage with links to all CRUD operations and analytical queries. Try:
- Adding a new room
- Viewing comfort ratings (with occupant and room names joined)
- Exploring the seasonal energy analysis
- Deleting a room (note the confirmation step)
10.2.7.6 Key Takeaways
- Web frameworks abstract SQL - The browser becomes your database interface
- Same queries, different interface - Every SQL query from the previous section has a web equivalent
- Thin abstraction layer - Flask adds minimal code between HTTP requests and SQL execution
- User-friendly - End users don’t need to know SQL to interact with the data
This pattern scales: production applications use the same concepts, just with more sophisticated frameworks (Django, Ruby on Rails, ASP.NET) and security features. But the core principle remains: web pages are just SQL queries in disguise.
10.2.8 CRUD using Natural Language
We’ve now seen three ways to interact with our database:
- SQL - Direct queries (precise, but requires SQL knowledge)
- Web forms - HTML interfaces (user-friendly, but requires building and maintaining web pages)
- Natural language - The next frontier
10.2.8.1 The Natural Language Abstraction
Large Language Models (LLMs) have introduced a new level of abstraction: asking questions in plain English and getting answers from your database. Instead of writing SQL or clicking through forms, you can simply ask:
“What was the average energy consumption in winter months when occupants were comfortable?”
The LLM translates this to SQL, executes it, and returns results in natural language. This pattern is emerging rapidly across database tools and could fundamentally change how non-technical users interact with data.
10.2.8.2 How It Works
The general pattern:
- User asks a question in natural language
- LLM analyzes the question and the database schema
- LLM generates SQL that answers the question
- System executes SQL on the database
- LLM formats results in human-readable form
For example:
User: "Which room has the most comfort complaints?"

LLM generates:
SELECT r.room_name, COUNT(*) as complaints
FROM ComfortRating cr
JOIN Room r ON cr.room_id = r.room_id
WHERE cr.pmv_rating < -0.5 OR cr.pmv_rating > 0.5
GROUP BY r.room_name
ORDER BY complaints DESC
LIMIT 1

System returns: "Living Room with 253 complaints"
10.2.8.3 Benefits
1. Democratizes Data Access
- Non-technical users can query databases without learning SQL
- Reduces dependency on data analysts for simple questions
- Faster iteration on exploratory data analysis
2. Flexibility
- No need to pre-build every possible query as a web page
- Users can ask questions you never anticipated
- Natural follow-up questions work seamlessly
3. Contextual Understanding
- LLMs can (sometimes?) interpret ambiguous queries using schema context
- Can suggest clarifying questions when queries are unclear
- Can explain results in domain-specific terms
10.2.8.4 Pitfalls and Limitations
1. Accuracy Concerns
- LLMs can generate incorrect SQL, especially for complex queries
- Subtle logical errors may go unnoticed by non-technical users
- Always verify critical results against known benchmarks
2. Security Risks
- Potential for SQL injection if not properly sandboxed
- Users might inadvertently access sensitive data
- Need strict permission controls and query validation
3. Black Box Problem
- Users may not understand how answers were derived
- Difficult to debug when results seem wrong
- Loss of SQL literacy over time as users rely on natural language
4. Performance Issues
- LLMs may generate inefficient queries
- No guarantee of query optimization
- Repeated similar questions don’t benefit from caching (unless explicitly implemented)
5. Schema Dependency
- Requires clear table and column names for good results
- Ambiguous schema designs confuse the LLM
- Works best with well-documented, normalized databases
10.2.8.5 A Practical Example: sqlite-utils-ask
One implementation of this pattern is sqlite-utils-ask by Simon Willison. This tool uses OpenAI’s GPT models to answer questions about SQLite databases in natural language.
Installation:
# Install sqlite-utils with the ask plugin
pip install sqlite-utils
sqlite-utils install sqlite-utils-ask

# Set your OpenAI API key
export OPENAI_API_KEY="your-api-key-here"
Note: You’ll need to have your own API key for this to work.
Basic Usage:
Ask questions about our thermal comfort database:
# Ask a question
sqlite-utils ask comfort-energy.db "What was the average PMV rating in the Living Room?"
The tool will:
- Examine the database schema
- Generate appropriate SQL
- Execute the query
- Return results in natural language
Example Questions to Try:
# Simple aggregation
sqlite-utils ask comfort-energy.db "How many comfort ratings were recorded?"

# Temporal analysis
sqlite-utils ask comfort-energy.db "What was the total energy consumption in January 2024?"

# Join query
sqlite-utils ask comfort-energy.db "Which occupant reported feeling uncomfortable most often?"

# Complex analytical query
sqlite-utils ask comfort-energy.db "Compare average power consumption between summer and winter months"
Seeing the Generated SQL:
Add the --sql flag to see what SQL was generated:
sqlite-utils ask comfort-energy.db "Which room is most comfortable?" --sqlThis is valuable for:
- Learning SQL from natural language examples
- Verifying the query logic
- Understanding how the LLM interpreted your question
10.2.8.6 When to Use Each Interface
| Interface | Best For | Avoid When |
|---|---|---|
| SQL | Precise queries, performance-critical operations, production systems | Non-technical users, exploratory analysis |
| Web Forms | Predefined workflows, data entry, public-facing applications | Ad-hoc analysis, rapidly changing requirements |
| Natural Language | Exploratory analysis, one-off questions, democratizing data access | Mission-critical queries, high-security contexts, complex transactions |
10.2.8.7 The Future
Natural language database interfaces are still evolving, but the trajectory is clear:
- Hybrid approaches combining natural language with traditional SQL for complex queries
- Query validation where LLMs explain their SQL before execution
- Multi-turn conversations that refine queries through dialogue
- Automatic visualization of results based on query intent
As these tools mature, the gap between “thinking of a question” and “getting an answer” will shrink dramatically. However, understanding the underlying SQL and database design remains crucial—both for building robust systems and for validating results when they matter.
10.2.8.8 Key Takeaway
Each abstraction layer trades power and precision for accessibility and ease of use:
SQL → Web Forms → Natural Language
↑                                 ↑
Precise, fast, experts only      Accessible, flexible, everyone
The best data systems often support multiple interfaces, letting users choose the right tool for their task and skill level.